Get Zabbix server in India
1) Zabbix is a popular open-source monitoring tool that can be used to monitor a wide variety of IT infrastructure components such as servers, networks, applications, and services. It provides a comprehensive monitoring solution with features such as data collection, analysis, and visualization.
2) Zabbix has gained popularity over the years because of its flexibility and scalability. It is highly customizable and can be configured to monitor just about any device or service in your IT environment. Additionally, it has a web-based interface that makes it easy to set up and use, and it supports multiple monitoring protocols including SNMP, ICMP, JMX, and more.
3) Zabbix is also known for its alerting capabilities, allowing you to configure alerts for any monitored item based on specific thresholds or conditions. You can also use Zabbix to generate reports and visualize data using graphs, charts, and tables.
4) If you are having servers with other service providers and looking forward to setting up a monitoring server with HostingRaja, consider buying VPS Hosting or a Dedicated Server or Cloud Server from us.
High Availability Cluster servers provide server-level redundancy, while disk RAID provides storage-level redundancy and performance.
Starting @ 9999
Get StartedVPS hosting allows for a customized and scalable server environment, while disk RAID protects against data loss and improves speeds.
Starting @ 549
Get StartedDedicated servers provide complete control and performance, while high-performance disk RAID delivers faster read/write speeds.
Starting @ 3299
Get Started
Cloud servers offer scalable and flexible computing resources, while disk RAID provides data redundancy and performance.
Starting @ 1062
Get StartedHaving a monitoring server in a separate data center can provide several benefits, including:
Increased resilience:
If a data center experiences an outage or disruption, having a monitoring server in a separate data center ensures that you can continue to monitor your infrastructure and applications. This helps reduce downtime and ensures that you can respond quickly to any issues that arise.
Improved disaster recovery:
In the event of a disaster or outage, having a monitoring server in a separate data center can help with disaster recovery efforts. This can help ensure that critical systems are brought back online as quickly as possible, reducing the impact of the outage.
Improved security:
By separating your monitoring infrastructure from your production infrastructure, you can reduce the risk of security breaches. This is because attackers would need to breach two separate data centers to gain access to both your production and monitoring environments, making it much more difficult to compromise both.
Reduced network congestion:
If you have a large infrastructure with many systems and applications, having a monitoring server in the same data center can put additional strain on the network. By separating your monitoring infrastructure, you can reduce the amount of traffic on your network, improving performance and reducing the risk of network congestion.
Overall, having a monitoring server in a separate data center can provide significant benefits, including increased resilience, improved disaster recovery, improved security, and reduced network congestion.
In summary, Zabbix is a powerful monitoring tool that can be used to monitor a wide range of IT infrastructure components. It is highly customizable, flexible, and scalable, making it a great choice for organizations of all sizes. Its robust features and ease of use make it a Swiss Army Knife of monitoring tools.
What is Zabbix? An overview of the software and its capabilities.
Zabbix is designed to be flexible and customizable, with a wide range of monitoring options available out of the box, including SNMP, JMX, IPMI, and more. It also has an extensive library of plugins and extensions that can be used to extend its functionality.
Some of the key capabilities of Zabbix include:
Real-time monitoring: Zabbix can monitor various systems and services in real-time, providing up-to-the-minute information on system health and performance.
Alerting and notifications: Zabbix can be configured to send alerts and notifications via email, SMS, or other methods when issues are detected.
Dashboards and visualizations: Zabbix provides a range of dashboard and visualization options, enabling users to create custom views of their monitoring data.
Performance analysis: Zabbix includes a range of performance analysis tools, including trend analysis and anomaly detection, to help identify potential issues before they cause any problems.
Integration with other systems: Zabbix can be integrated with other systems and tools, such as Grafana and Prometheus, to provide enhanced monitoring capabilities.
Overall, Zabbix is a powerful and flexible monitoring solution that can be customized to meet the specific needs of any organization, from small businesses to large enterprises.

Installation and configuration: A step-by-step guide to installing and setting up Zabbix.
Here is a step-by-step guide to installing and setting up Zabbix:
Step System Requirements: Make sure your system meets the minimum requirements for installing Zabbix. You will need a Linux-based operating system, at least 4GB of RAM, and around 20GB of disk space.
Install Required Packages: Install the required packages by running the following command:
Install Zabbix Server:Download the latest version of Zabbix from the official website and extract the files to a directory of your choice.
Create a Database: Create a new database for Zabbix by running the following commands:
Import Database Schema: Import the Zabbix database schema by running the following command:
Configure Zabbix Server: Edit the zabbix_server.conf configuration file and set the following values:

Start Zabbix Server: Start the Zabbix server by running the following command:
Install Zabbix Web Interface: Install the Zabbix web interface by running the following command:
Configure Zabbix Web Interface: Edit the zabbix.conf.php configuration file and set the following values:
Access Zabbix Web Interface: Open a web browser and navigate to http://server_ip/zabbix. Log in with the default username Admin and password zabbix.
That’s it! You should now have Zabbix up and running on your system. From here, you can begin configuring hosts, triggers, and other monitoring parameters to suit your needs.
Monitoring with Zabbix: A look at how to use Zabbix to monitor various types of systems and services.

Zabbix provides a wide range of monitoring capabilities to help businesses monitor their IT infrastructure. Here’s a look at how you can use Zabbix to monitor various types of systems and services:
Network Devices: Zabbix can monitor network devices such as routers, switches, and firewalls using SNMP. You can configure Zabbix to monitor interface status, traffic, errors, and other parameters to ensure that your network is running smoothly.
Servers: Zabbix can monitor servers running Linux, Windows, or other operating systems using various methods such as SNMP, JMX, IPMI, and agent-based monitoring. You can monitor system resources such as CPU, memory, disk usage, and network activity to identify potential issues before they become critical.
Applications: Zabbix can monitor various types of applications such as web servers, databases, and messaging systems using specialized agents or plugins. For example, you can use the Zabbix Apache plugin to monitor Apache web server performance and identify issues such as slow response times or high CPU usage.
Cloud Services: Zabbix can monitor Cloud Services such as AWS and Azure using APIs to track metrics such as CPU utilization, memory usage, and network traffic. This can help you monitor the health of your cloud infrastructure and identify issues before they impact your business.
Virtualization: Zabbix can monitor virtualization platforms such as VMware and KVM using APIs or specialized agents. You can monitor virtual machine performance, resource usage, and availability to ensure that your virtualized environment is running smoothly.
Web Applications: Zabbix can monitor web applications using the Zabbix web scenario feature. You can simulate user actions on your website to check for issues such as broken links, slow response times, and error messages.
Overall, Zabbix provides a wide range of monitoring capabilities to help businesses keep their IT infrastructure running smoothly. By configuring Zabbix to monitor your systems and services, you can proactively identify and resolve issues before they impact your business.
Alerts and notifications: How to configure Zabbix to send alerts and notifications when issues are detected.

Configuring alerts and notifications is an essential part of any monitoring system, and Zabbix provides a flexible and robust alerting system. Here’s how to configure Zabbix to send alerts and notifications when issues are detected:
Create a Media Type: A media type defines how Zabbix will send notifications, such as email, SMS, or instant messaging. To create a new media type, go to Administration > Media types and click Create Media Type. Choose the appropriate type, such as Email or SMS, and enter the required information, such as email address or phone number.
Create a User Group: A user group defines the users who will receive notifications. To create a new user group, go to Administration > User groups and click Create User Group. Enter a name for the group and add the users who should receive notifications.
Configure Triggers: A trigger defines the condition that will trigger an alert. To create a new trigger, go to Configuration > Hosts and click on a host. Then go to Triggers and click Create Trigger. Choose the appropriate condition, such as CPU usage exceeding a certain threshold, and configure the trigger to your requirements.
Create an Action: An action defines what happens when a trigger is triggered. To create a new action, go to Configuration > Actions and click Create Action. Choose the appropriate conditions, such as which triggers will trigger the action, and configure the action to your requirements. You can choose the media type and user group that will receive notifications and configure the message that will be sent.
Test the Notification: Once you’ve configured the alerting system, it’s essential to test it to ensure that notifications are being sent correctly. You can do this by triggering a test alert and checking that the notification is received.
Overall, Zabbix’s alerting system provides a flexible and customizable way to configure notifications for different types of alerts. By configuring alerts and notifications, you can ensure that your team is alerted promptly when issues are detected, enabling them to take quick action and minimize downtime.
Dashboards and visualizations: An exploration of Zabbix’s dashboard and visualization capabilities.

Zabbix provides a range of dashboard and visualization capabilities that enable you to view and analyze monitoring data in a visual and user-friendly way. Here’s an exploration of Zabbix’s dashboard and visualization capabilities:
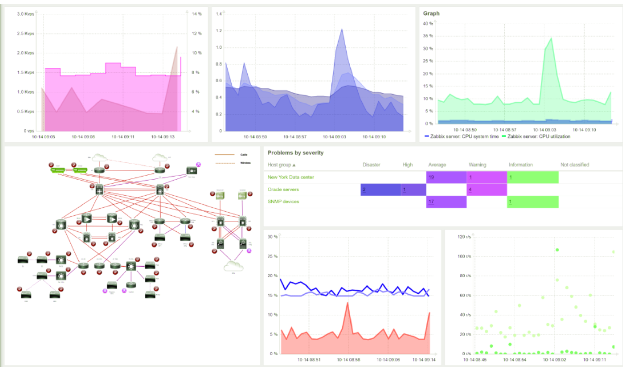
Dashboards: Zabbix’s dashboard feature allows you to create custom dashboards to display important monitoring data at a glance. You can create different dashboard widgets that display different types of data, such as graphs, charts, and maps. The widgets can be organized into different sections, allowing you to create a customized layout that meets your needs.
Graphs: Zabbix’s graph feature allows you to visualize historical data for different monitored items. You can create custom graphs that display data for a specific time period, such as the past hour, day, week, or month. You can also customize the graph’s appearance by choosing different graph types, colors, and labels.
Maps: Zabbix’s map feature allows you to create network maps that display the status of different hosts and their relationships. You can create custom maps that display hosts and their dependencies, allowing you to quickly identify issues and their root causes. Maps can be customized with icons, labels, and colors, making them easy to read and understand.
Screens: Zabbix’s screen feature allows you to create custom screens that display multiple graphs, maps, and other widgets on a single screen. You can create different screens for different purposes, such as displaying system status, network performance, or application health. Screens can be customized with different layouts, sizes, and colors, making them easy to read and navigate.
Reports: Zabbix’s report feature allows you to generate custom reports based on monitoring data. You can create reports that display data for a specific time period, such as the past week, month, or year. Reports can be customized with different templates, charts, and tables, making them easy to read and share with others.
Overall, Zabbix’s dashboard and visualization capabilities provide a powerful way to view and analyze monitoring data in a visual and user-friendly way. By using these features, you can gain insights into your IT infrastructure’s health and performance, enabling you to make informed decisions and take corrective action when necessary.
Integrations with other systems: How to integrate Zabbix with other systems and tools for enhanced monitoring capabilities.

Zabbix provides a range of integration options that enable you to enhance your monitoring capabilities by integrating with other systems and tools. Here’s how to integrate Zabbix with other systems:
SNMP: Zabbix supports Simple Network Management Protocol (SNMP), which enables you to monitor devices that support SNMP, such as routers, switches, and printers. You can configure Zabbix to poll SNMP-enabled devices for performance data and display the data on graphs and charts.
JMX: Zabbix supports Java Management Extensions (JMX), which enables you to monitor Java applications and middleware. You can configure Zabbix to collect JMX data from Java applications and middleware and display the data on graphs and charts.
APIs: Zabbix provides a range of APIs that enable you to integrate Zabbix with other systems and tools. You can use the APIs to retrieve monitoring data, configure hosts and triggers, and perform other tasks programmatically.
Plugins: Zabbix provides a range of plugins that enable you to integrate Zabbix with other systems and tools, such as Slack, Grafana, and Nagios. The plugins enable you to send alerts and notifications to different systems, visualize monitoring data in different ways, and perform other tasks.
Scripting: Zabbix provides a range of scripting options that enable you to customize monitoring and integration tasks. You can write custom scripts that interact with Zabbix’s APIs or other systems’ APIs, enabling you to automate tasks and integrate with different systems and tools.
Overall, Zabbix’s integration options provide a powerful way to enhance your monitoring capabilities by integrating with other systems and tools. By integrating with other systems, you can monitor different types of devices and applications, visualize monitoring data in different ways, and automate tasks to reduce manual work.
Best practices for using Zabbix: Tips and tricks for getting the most out of Zabbix.
Here are some best practices for using Zabbix to ensure that you get the most out of this powerful monitoring tool:
Plan your monitoring strategy: Before you start monitoring with Zabbix, it’s important to plan your monitoring strategy. Define the hosts, services, and metrics that you want to monitor, and establish monitoring thresholds and alerting rules.
Organize your monitoring: Use Zabbix’s host and group management features to organize your monitoring in a logical way. Create host groups based on location, environment, or application, and use templates to configure hosts with similar monitoring requirements.
Fine-tune your monitoring: Use Zabbix’s flexible monitoring options to fine-tune your monitoring. Adjust polling intervals, configure item types and parameters, and use calculated items and triggers to create more complex monitoring scenarios.
Optimize performance: Zabbix is a resource-intensive application, so it’s important to optimize performance to ensure that it can handle your monitoring requirements. Use Zabbix’s database and server tuning options to optimize performance, and monitor resource usage to identify potential bottlenecks.
Use automation: Use Zabbix’s automation features to automate repetitive tasks, such as adding new hosts, updating templates, and configuring triggers. This will reduce manual work and ensure that your monitoring remains up-to-date.
Monitor Zabbix itself: It’s important to monitor Zabbix itself to ensure that it’s running smoothly and handling your monitoring requirements. Use Zabbix’s built-in monitoring templates to monitor Zabbix’s server, database, and network performance.
Regularly review and update your monitoring: Your IT infrastructure is constantly changing, so it’s important to regularly review and update your monitoring. Add new hosts and services as they’re deployed, retire old monitoring configurations that are no longer needed, and fine-tune monitoring thresholds and alerting rules as needed.
By following those great practices, you may make certain which you get the maximum out of Zabbix and maintain a robust and effective monitoring system for your IT infrastructure.
Zabbix vs. other monitoring tools: A comparison of Zabbix with other popular monitoring tools in the market.
Zabbix is a powerful and flexible monitoring tool, but it’s not the only option in the market. Here’s a comparison of Zabbix with other popular monitoring tools:
Nagios: Nagios is one of the most popular open-source monitoring tools. Like Zabbix, it supports monitoring of hosts, services, and network devices. However, Nagios has a steeper learning curve than Zabbix, and it lacks some of Zabbix’s advanced features, such as integrated visualization and discovery.
Prometheus: Prometheus is a popular open-source monitoring tool designed for monitoring cloud-native environments. It uses a pull-based model for monitoring, where agents scrape metrics from applications and services. Prometheus has powerful query and alerting capabilities, but it doesn’t support agentless monitoring, and its visualization features are less sophisticated than Zabbix’s.
Grafana: Grafana is a popular open-source visualization tool that’s often used in conjunction with monitoring tools like Zabbix and Prometheus. It provides powerful dashboarding and data visualization capabilities, but it doesn’t provide monitoring capabilities on its own.
Splunk: Splunk is a commercial monitoring tool that provides powerful log analysis and monitoring capabilities. It’s highly scalable and provides advanced search and visualization features, but it’s more expensive than Zabbix and requires significant configuration to set up.
Datadog: Datadog is a commercial monitoring tool that provides monitoring of cloud-based environments, including containers and microservices. It has a wide range of integrations and provides powerful visualization and alerting capabilities. However, it’s more expensive than Zabbix and may be overkill for smaller environments.
Overall, Zabbix provides a strong balance of features, flexibility, and ease of use compared to other monitoring tools. However, depending on your specific monitoring needs and requirements, other tools may be a better fit. It’s important to evaluate your options carefully before making a decision on a monitoring tool.
Zabbix for enterprise: A look at how Zabbix can be used in enterprise environments for monitoring large-scale systems.
Zabbix is a highly scalable and flexible monitoring tool that can be used in enterprise environments to monitor large-scale systems. Here are some ways that Zabbix can be used in enterprise environments:
Distributed monitoring: Zabbix supports distributed monitoring, which allows you to monitor large-scale systems across multiple locations and data centers. You can set up Zabbix proxies to collect monitoring data from remote locations and send it back to the central Zabbix server for analysis and alerting.
High availability:Zabbix supports high availability configurations, which ensure that monitoring data is always available and alerts are never missed. You can set up redundant Zabbix servers and database clusters to ensure that monitoring data is always available.
Performance monitoring: Zabbix provides powerful performance monitoring capabilities, which allow you to monitor the performance of your applications and infrastructure in real-time. You can monitor CPU usage, memory usage, disk I/O, and network traffic, among other metrics, to identify performance bottlenecks and optimize your systems for maximum performance.
Log monitoring: Zabbix also provides log monitoring capabilities, which allow you to monitor log files for specific events and trigger alerts based on those events. This can be useful for detecting security breaches or other critical events in real-time.
Integration with other systems: Zabbix can be integrated with other systems and tools, such as ticketing systems, configuration management tools, and automation tools, to provide a comprehensive monitoring and management solution.
Customization: Zabbix provides a high degree of customization, allowing you to configure monitoring rules and alerting thresholds to match your specific requirements. You can also create custom dashboards and reports to provide visibility into your systems and services.
Overall, Zabbix is a powerful monitoring tool that can be used in enterprise environments to monitor large-scale systems. Its scalability, flexibility, and customization capabilities make it an excellent choice for organizations that need to monitor complex, distributed systems.
Zabbix plugins and extensions: An overview of the various plugins and extensions available for Zabbix to extend its functionality.
Zabbix has a wide range of plugins and extensions available that can be used to extend its functionality and provide additional monitoring capabilities. Here are some of the most popular plugins and extensions for Zabbix:
Zabbix plugins: Zabbix provides a plugin framework that allows you to extend its functionality by writing custom plugins. Plugins can be used to monitor specific applications, services, or devices that are not supported out of the box by Zabbix. You can find a list of official and community-supported plugins on the Zabbix website.
SNMP monitoring: Zabbix supports Simple Network Management Protocol (SNMP) monitoring, which allows you to monitor network devices such as routers, switches, and firewalls. You can use the Zabbix SNMP template to monitor SNMP-enabled devices and receive alerts when problems are detected.
JMX monitoring: Zabbix supports Java Management Extensions (JMX) monitoring, which allows you to monitor Java applications and services. You can use the Zabbix JMX template to monitor JMX-enabled applications and receive alerts when problems are detected.
IPMI monitoring: Zabbix supports Intelligent Platform Management Interface (IPMI) monitoring, which allows you to monitor hardware sensors such as temperature, voltage, and fan speed on servers and other devices. You can use the Zabbix IPMI template to monitor IPMI-enabled devices and receive alerts when problems are detected.
Integration with other tools: Zabbix can be integrated with other tools and systems, such as Nagios, Cacti, and Grafana, to provide additional monitoring and visualization capabilities. You can also use Zabbix API to integrate with your own custom tools and applications.
Custom scripts: Zabbix allows you to write custom scripts that can be used to monitor and collect data from systems and applications that are not supported out of the box. You can use custom scripts to monitor specific metrics, such as database connections or CPU usage, and receive alerts when thresholds are exceeded.
Overall, Zabbix provides a wide range of plugins and extensions that can be used to extend its functionality and provide additional monitoring capabilities. These plugins and extensions allow you to customize Zabbix to meet your specific monitoring requirements and provide a comprehensive monitoring solution for your infrastructure.
How HostingRaja’s 24/7 Managed Support for Zabbix Servers helps you?
Providing 24/7 support for a MongoDB cluster involves ensuring that the database system remains available and operational at all times. Here are six key points to consider when providing support for a MongoDB cluster:
Monitoring: Monitoring the health and performance of the cluster is essential for identifying and resolving issues before they affect the system. Tools such as MongoDB Cloud Manager or Ops Manager can provide real-time monitoring and alerting for the cluster.
Automation: Automating routine tasks, such as backups, updates, and failover, can help reduce the risk of human error and ensure that the system is always running optimally. Tools such as Ansible or Puppet can be used to automate these tasks.
Security: Ensuring that the MongoDB cluster is secure is critical for protecting sensitive data. This involves implementing appropriate security measures, such as firewalls, access controls, and encryption, and regularly reviewing and updating security policies.
Disaster Recovery: Having a disaster recovery plan in place can help minimize downtime and data loss in the event of a catastrophic failure. This involves regularly backing up data and having a plan in place for restoring the database in the event of a failure.
Response Time: When issues do occur, it’s essential to respond quickly to minimize the impact on the system. Having a dedicated support team available 24/7 to handle issues as they arise is critical for ensuring that the system remains operational.
Continuous Improvement: Finally, continuously improving the MongoDB cluster over time can help optimize its performance and ensure that it remains scalable and resilient. This involves regularly reviewing system metrics and performance data, identifying areas for improvement, and implementing changes to optimize the system.
Cost Savings: Hiring a full-time in-house DBA can be costly. HostingRaja database administration service can help reduce costs by only paying for the services needed, rather than having a full-time employee on payroll with benefits.
Access to Expertise: Database administration is a highly specialized field. Our 10+ years of experts can provide access to a broad range of skills and experience that may not be available in-house. This can help improve the overall performance, efficiency, and reliability of the database system.
Flexibility and Scalability: Our 24/7 Managed support gives you flexibility and scalability. As business needs change, you can easily adjust the level of service provided, adding or removing resources as needed.
Reduced Risk: HostingRaja team of experts can help reduce the risk of data breaches or other security concerns. External providers have a dedicated focus on security and can provide additional resources, such as data backups and disaster recovery plans.
24/7 Support: Our 24/7 managed support team can offer around-the-clock support, ensuring that any issues are promptly addressed, even outside of business hours.
Access to New Technologies: Our team often has access to the latest technologies and software updates. Outsourcing can provide access to new tools and features, ensuring that the database system remains up-to-date and optimized.
Improved Performance: HostingRaja database administration can help improve overall performance by ensuring that the database is properly optimized and configured for maximum efficiency.
Overall, HostingRaja’s database administration can provide cost savings, access to expertise, flexibility, reduced risk, 24/7 support, improved focus, access to new technologies, and improved performance.
Implement a disaster recovery plan: A disaster recovery plan should be in place to ensure that the Percona Cluster can be restored in the event of a disaster. This plan should include backup and recovery procedures, emergency contacts, and communication plans.
In summary, backup and recovery of a Percona Cluster is critical for ensuring data availability and minimizing downtime in the event of a disaster or data loss. By using tools like Percona XtraBackup, scheduling regular backups, testing backup and recovery procedures, and automating processes, you can ensure that your Percona Cluster is protected and can be restored quickly and efficiently in the event of a disaster.

HostingRaja Zabbix Server FAQ’s
How does Zabbix Server work?
Zabbix Server collects data from various monitored devices and systems using agents or passive checks. It stores this data in a database and provides a web interface for visualization, alerting, and reporting.
What are the key features of Zabbix Server?
Zabbix Server offers a wide range of features, including auto-discovery of devices, flexible monitoring options (such as SNMP, IPMI, JMX, etc.), customizable dashboards and visualization, trigger-based alerting, extensive reporting capabilities, distributed monitoring, and support for multiple platforms and devices.
What is Zabbix agent?
Zabbix agent is a lightweight software installed on the devices to be monitored. It collects data about the system, applications, and services and sends it to the Zabbix Server for processing and analysis.
Can Zabbix Server monitor cloud-based services and infrastructure?
Yes, Zabbix Server can monitor cloud-based services and infrastructure. It supports monitoring of various cloud platforms such as AWS, Azure, and Google Cloud, enabling you to monitor virtual machines, storage, databases, and other cloud resources.
Does Zabbix Server support high availability and scalability?
Yes, Zabbix Server supports high availability and scalability. It offers options for distributed monitoring with multiple Zabbix Server instances and supports database replication and clustering to ensure high availability and improved performance.
Can Zabbix Server send notifications and alerts?
Yes, Zabbix Server can send notifications and alerts when predefined conditions or triggers are met. It supports various notification methods, including email, SMS, instant messaging, and integrations with popular messaging platforms like Slack or Microsoft Teams.
Is Zabbix Server customizable?
Yes, Zabbix Server is highly customizable. You can create custom dashboards, reports, and screens to visualize the monitored data according to your specific requirements. It also supports custom scripts, user-defined parameters, and custom templates for monitoring different types of devices and applications.
What databases can be used with Zabbix Server?
Zabbix Server supports multiple databases, including MySQL, PostgreSQL, and Oracle. You can choose the database that best suits your environment and scalability needs.
Is technical support available for Zabbix Server?
Yes, technical support is available for Zabbix Server. The Zabbix community provides forums, documentation, and resources for self-help. Additionally, commercial support options are available from Zabbix, which provide professional assistance and access to advanced features.
Reviews from Zabbix Server Customers
-

Santhosh
03 Jun 2025HostingRaja’s Zabbix Server is a great tool for watching over our computer systems. By combining Zabbix’s free software with HostingRaja’s skill in hosting servers, we have a strong way to manage our resources. It’s easy to set up, and their support is available all the time, which makes it one of the best choices for businesses in India.
Varun Reddy
11 Mar 2025For the last 6 months, I’ve been utilizing HostingRaja’s Zabbix Server, and I’m truly satisfied with my experience. The server has proven to be dependable, and its monitoring capabilities cover a wide range. If you’re seeking a trustworthy and budget-friendly monitoring solution, I wholeheartedly suggest HostingRaja’s Zabbix Server.